


Google Analytics is your best friend for tracking marketing data from organic traffic to paid results or analyzing specific pages on your site.
It’s an easy and relatively straightforward way to track your website and campaign data.
But getting to know it takes some time.
In this guide, we’ll show you everything you need to know to master Google Analytics, track your campaigns and traffic, and measure results.
It will help you set up your account, install the necessary code to your site, add users, create tailor-made reports, and so much more.
From there, you can start using Google Analytics to see what’s working with your social ads, what isn’t, and what you need to do to improve.
Tracking is the name of the game for marketers and advertisers. If you’re not checking in on how your campaigns perform, how will you know what’s working?
That’s why using Google Analytics for social media is so important! The platform lets you track leads all the way from ad viewed to conversion and anywhere in between.
We know, Google Analytics gives advertisers A LOT of complex information. The sheer amount of data you can collect is overwhelming, which just makes sifting through it challenging.
Google recently launched a Marketing Platform to bring together its advertising and analytics platforms, but marketers still need to familiarize themselves with Analytics to make the most of the tool.
We’re here to help with this guide.
Let’s dive in!
Setting up Google Analytics for Social Media in 4 Steps
There’s so much you can do with Google Analytics that walking through the entire process would be a guide all on its own.
We’re going to focus on how to set up a tracking code to capture information about your website visitors, create admins who can run reports in your account, and customize your own experience within Google Analytics.
Let’s start with the basics.
Check out Google’s handy Getting Started guide and this quick overview by our friends over at Hootsuite if you’d like to learn more about getting started!
Step #1: Installing The Google Site Tag on Your Website
When you install this analytics tracking code on your website, it gives you the ability to track website visitors. Without this code, it’s impossible to capture any data.
First, select Admin from the left-hand menu options.
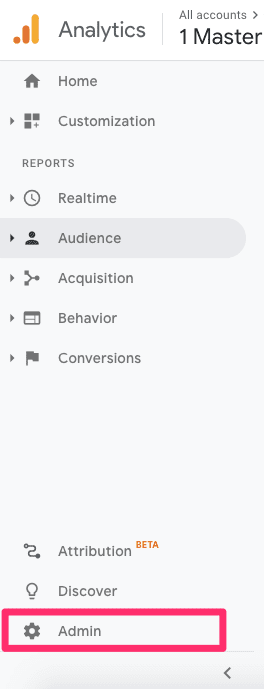

Then, locate the “Property” column in the center and click “Tracking Info.”
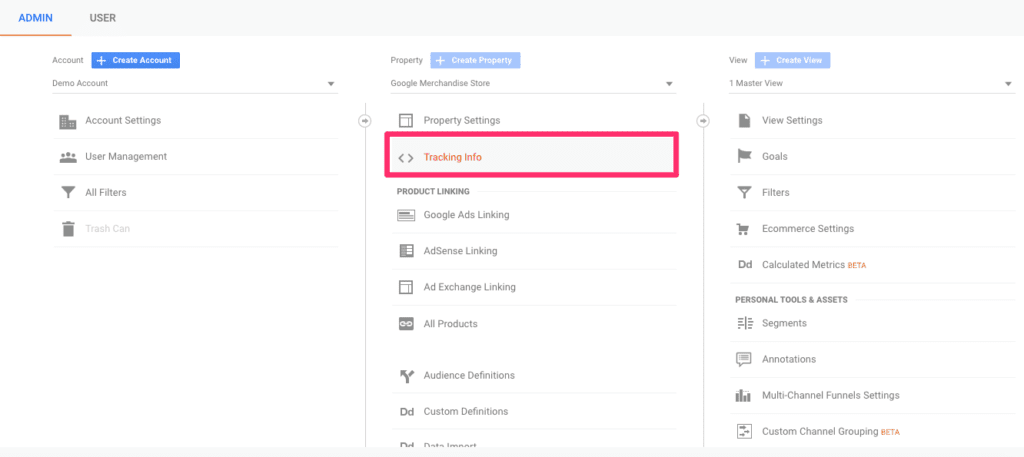

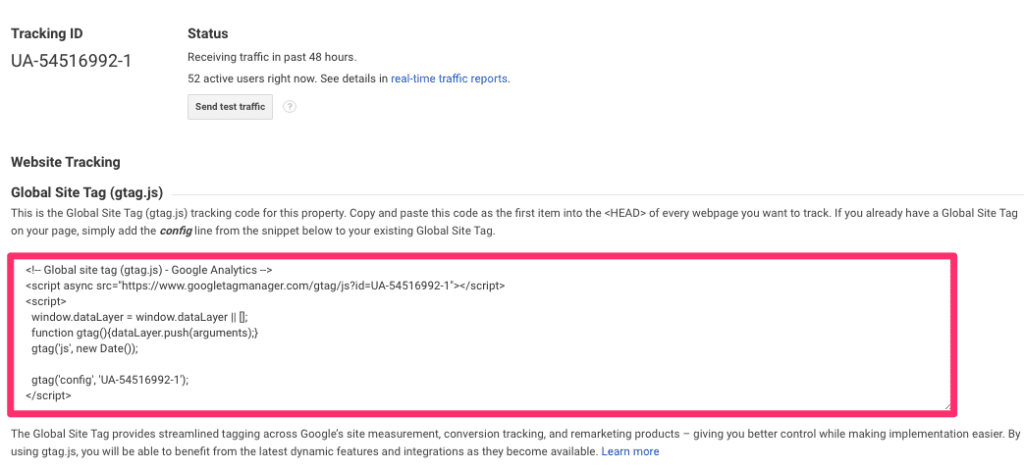
Selecting that option will give you a drop-down menu. You’re looking for the “Tracking Code” to add to your website.
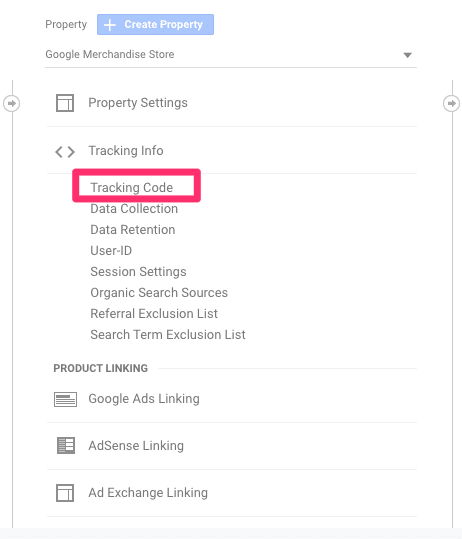

This code is the Global site tag you’ll install in the <head> section of every page of your website. And yes, it does have to be installed on every page you want to track.

There are a number of different ways to install this code—many people use a plugin, like these examples for WordPress, or install the code manually to the headers section of your website.


Theme header installation via Monster Insights
Just make sure you’re 100% comfortable with your coding abilities before moving forward with this route.
The Google Site Tag should be the very last thing that’s in the <head> section of your website.


Google Site Tag installed in the header section of WordPress via MonsterInsights
And there you have it!
Once the code is installed on your website, you’ll be able to start collecting a lot of data about your visitors.
Now you just have to set up your team so they can access this data as well.
Step #2: Creating Admins Who Can Access Google Analytics Data
Google Analytics has four permissions levels, each with different abilities. Setting the appropriate permissions for your team helps make it easy for everyone to accomplish their individual tasks as well as collaborate effectively.
When you’re giving access to your team, think about which employees need access to this data, either with or without your help. Just make sure you’re not giving too many people edit access; too many people making changes can get confusing.
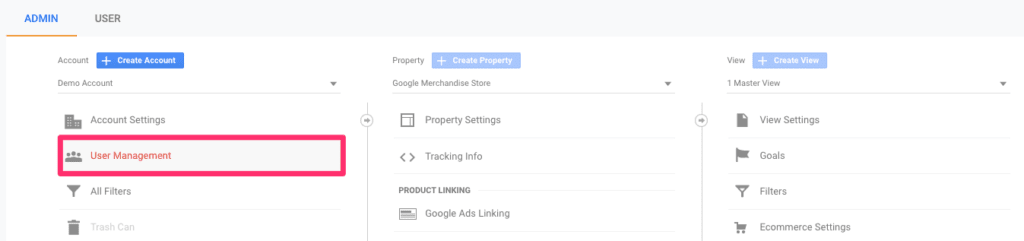
To set these permission levels, select the Admin menu.
Then, “User Management.”

From here, you will have four permissions levels to choose from:
- Manage Users: This grants permission to decide how others can make changes to your Google Analytics account. Reserve it for a select few people in your leadership team.
- Edit: An administrative level of permission. Users can create properties, views, filters, goals, etc. It’s a great option for strategy-focused members of your team.
- Collaborate: Collaborators can create and manage personal assets within Google Analytics, but are unable to make changes on an administrative level.
- Read & Analyze: The lowest level of permissions. Use it for employees who are just getting started with Google Analytics and don’t need to actively use the service on a daily basis.
Your advertising managers will likely require Edit access to Google Analytics, as will some members of their team.
Everyone else can be set to Collaborate or Read & Analyze so they can easily check in on the insights you find.
Now, with all the boring admin stuff out of the way, let’s take a look at how you can start creating goals, dashboards, and reports to track specific information.
Step #3: Creating Goals to Track Specifics
Goals are how you track specific actions a visitor takes while on your website.
Creating specific goals for your social media ads is the best way to track your ROI. Without these goals, you’ll never know how much of an impact your efforts truly make.
Start again in the Admin section of your Google Analytics account, then select “Goals” from the “View” options.
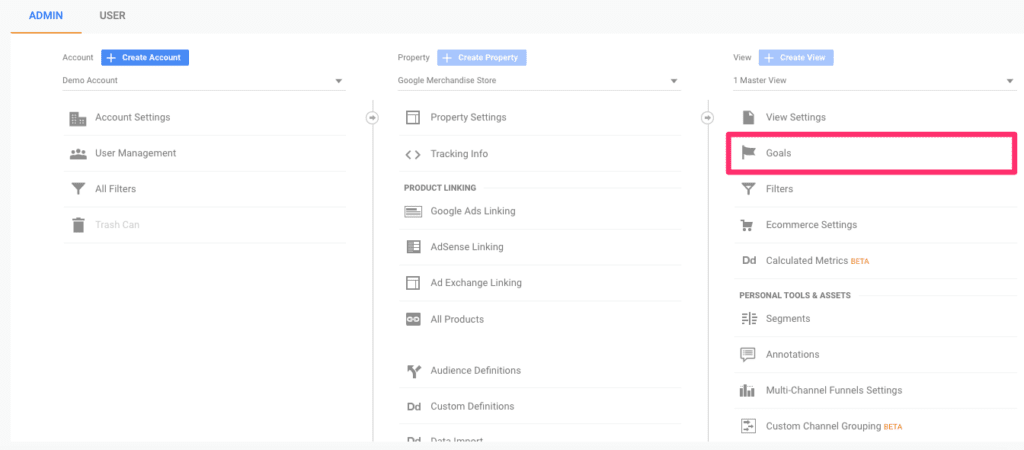

This will bring up a list of your current goals and give you the option to create new ones.
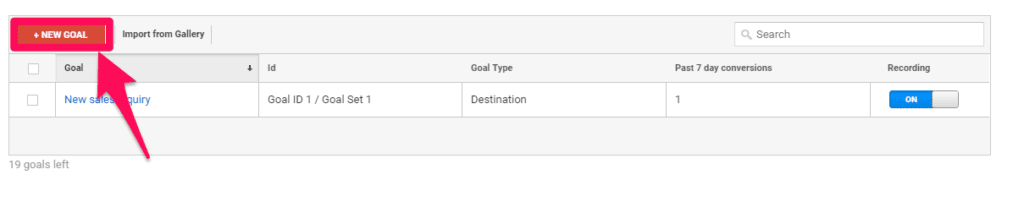

Creating a new goal starts by defining your ad’s objective. Google offers goal templates to simplify this process for you.
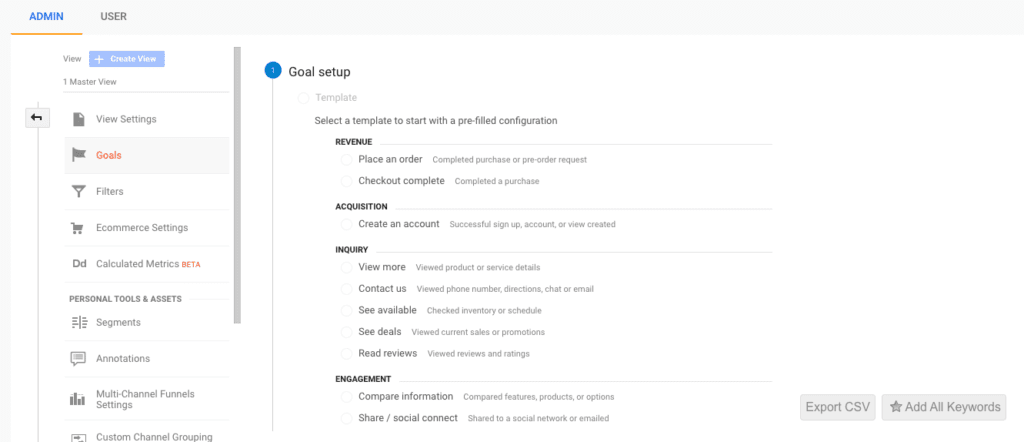

Templates are broken down into five different types:
- Revenue: Goals that are tied directly to when a user makes a purchase through your online store.
- Acquisition: Goals that are based on getting new leads into your funnel, like those who sign up for a newsletter about your product.
- Inquiry: Goals that have something to do with people requesting more information about your business. This could be filling out your contact page, or clicking a “Request more info” CTA on one of your ads.
- Engagement: Goals based on how someone interacts with your site. Whether that’s downloading an ebook or watching a product video.
- Custom: Anything you want them to be!
The goals you set influence what kind of data you’ll gather on visitors in Google Analytics.
Step #4: Building Dashboards and Reports for Quick Analysis
To track how well your ads are meeting your objectives, you can create Dashboards in Analytics.
These bring together specific elements of your Google Analytics account into a single view for easy analysis.

You can create these dashboards under the “Customization” drop-down menu by selecting “Dashboards.”
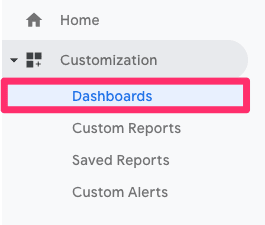

Then, click “Create.”
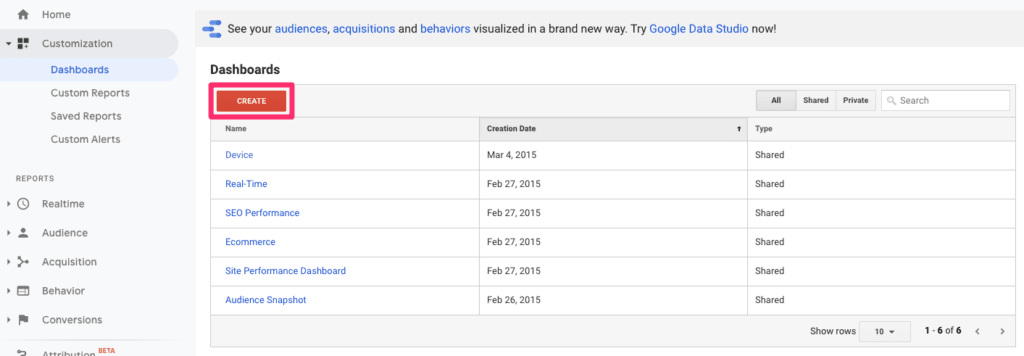

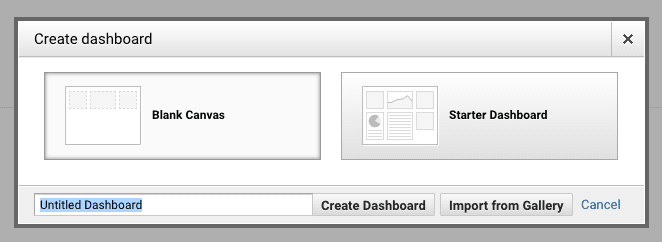
You’ll be prompted to give your dashboard a name and select whether or not you want to start with a “Blank Canvas” or a “Starter Dashboard.”
If this is your first time creating a dashboard, we suggest selecting the latter.

From here, you can add widgets, elements on the dashboard that highlight a single metric you want to track.
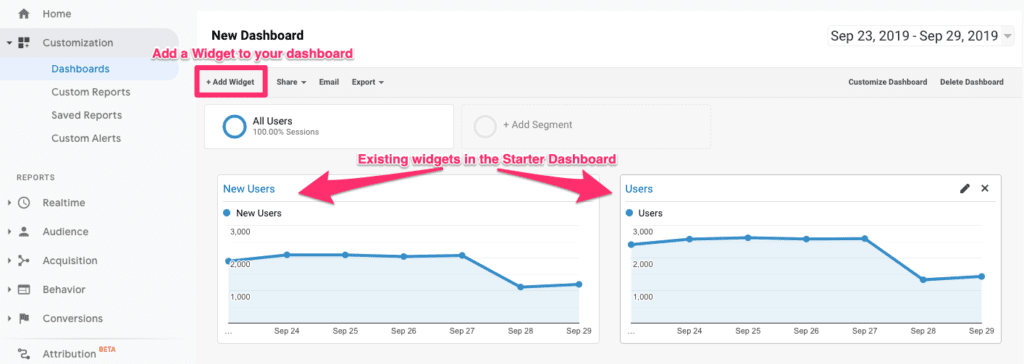

Here what it looks like when you add a widget:
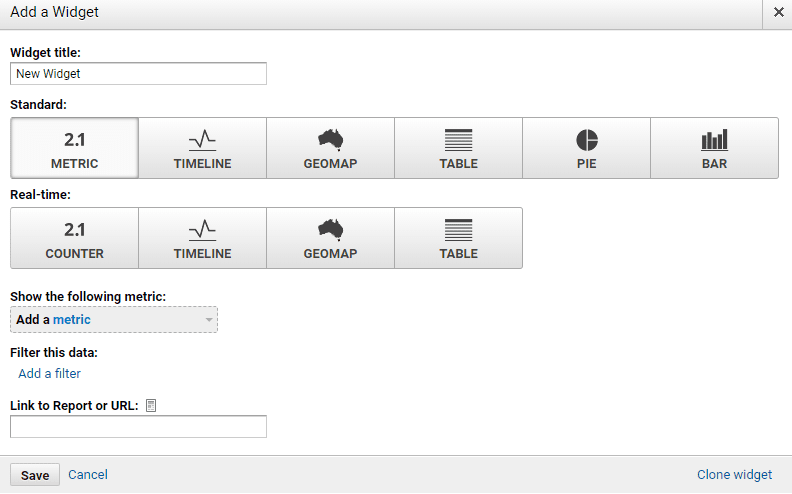

Let’s break these widgets down for you!
-
Widget type:
Select from Standard or Real-time widgets to define how you want the data to appear on your dashboard.
-
Metric:
Choose the main dimension you want to track in this widget.
-
Filters:
Segment your data further by additional factors.
Once that’s all set, it will look something like this:
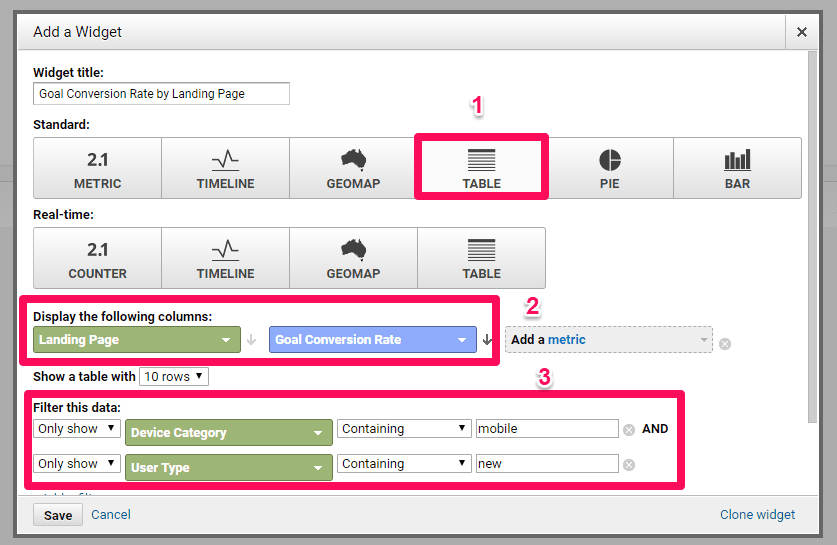

In this example, we want to see how mobile traffic converts on various landing pages.
We created this widget to display as a Table (1) with columns comparing Landing Pages and Goal Conversion Rate (2). To refine the search more, we also created a filter to show only new traffic coming from mobile devices (3).
Combine these dashboards with custom reports and you can tailor your Google Analytics account to display only the most valuable data for any campaign.
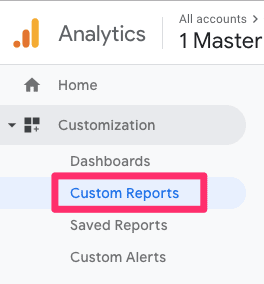
To create these reports, first select “Custom Reports” from within the “Customization” drop-down in your left-hand menu.

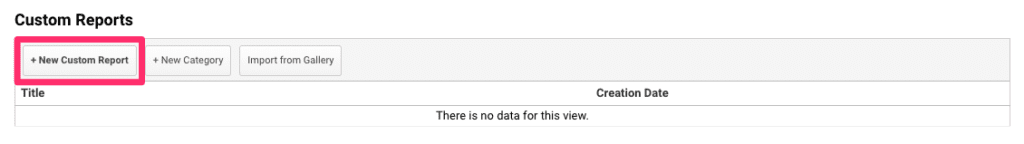
Then, click the “New Custom Report” button.

To create your personalized report dashboard, you need to set a number of specific parameters.
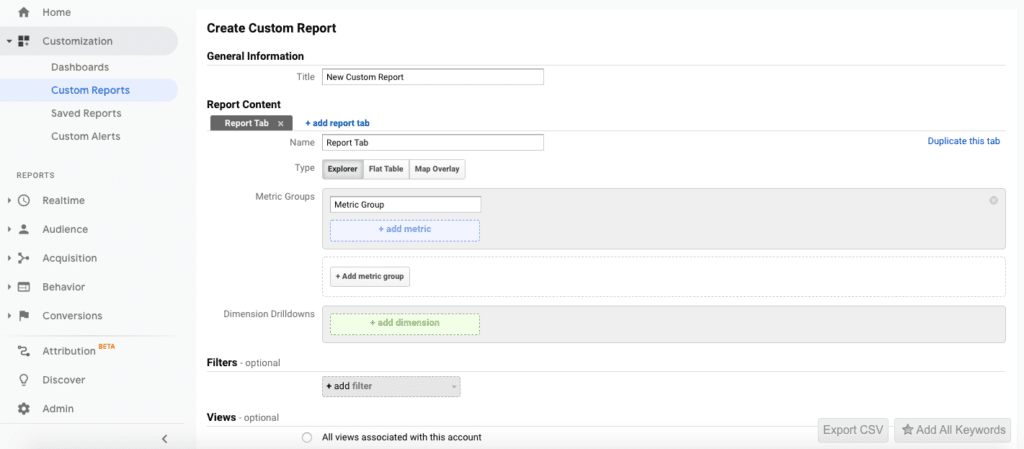

Google provides a lot of useful information on how to structure these reports, but it basically comes down to four things:
- The type of report you want to create,
- the dimensions and metrics you want to track,
- any filters you want to apply, and
- the specific Google Analytics views where the report is accessible.
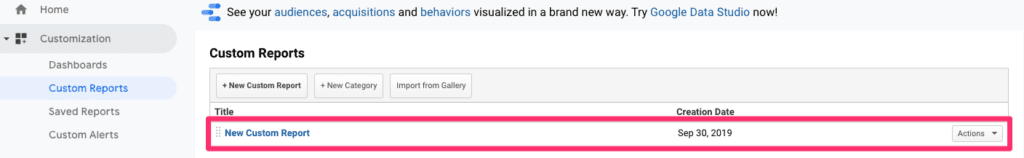
Once you create the report, you’ll be able to access and manage it directly in the “Custom Reports” section of your account.

Google Analytics is definitely one of the most comprehensive analytics tools around and it’s hard to narrow down what’s really important.
When you use custom reports and dashboards to display specific information and create goals that help you track your ad performance, it helps narrow down the data into exactly what you need.
Now that we have the “how” under control—let’s take a look at the why!
As we’ve seen, there’s a lot of different ways to look at your Google Analytics data, making sense of it all for your social media reporting is the next step.
Using Google Analytics for Social Media Reporting
When you leverage Google Analytics for social media, it not only helps you see what works, it helps you use that information to build better, more lucrative ad campaigns.
Understanding how each section of the account display information is paramount for good reporting.
Google breaks the data up into five distinct sections.
-
Realtime
-
Audience
-
Acquisition
-
Behavior
-
Conversions
Each provides valuable insight into a different aspect of your marketing and advertising campaigns.
Realtime Reporting in Google Analytics
Realtime reports are exactly what the name says, up-to-date accounting of the users currently interacting with your website.
This report lets you see how many people are on your site, the pages they’re viewing, session history, location, and much more. It’s a great place to track the impact of time-sensitive contests or promotions you’re running.
Let’s say you’re launching a new product and have been hyping it for weeks through an ad campaign; this report will show you how many people access your website as soon as the product is released.
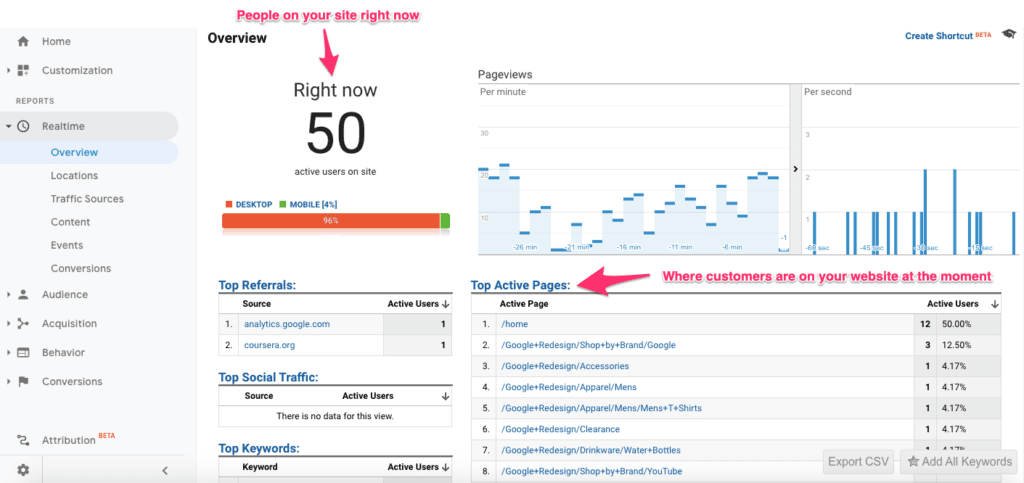

Within the real-time report, you have six drop-down menu options.
- Overview: High-level insights into what’s happening on your page right now. It includes the metrics below.
- Locations: The geographic location of your current site visitors.
- Traffic Sources: Where these visitors came from (social platform, organic search, etc.).
- Content: Which pages users are viewing right now.
- Events: Specific event actions your current users are taking.
- Conversions: Anyone who is converting right now.
The realtime report has very specific data that might not always be useful, but it provides a lot of insight into how people experience your website while they’re using it.
It can be fun to check in from time to time or used to watch how certain campaigns perform in real-time.
The report can be helpful if you’re expecting to see a large influx of users from your social media campaigns.
Audience Reporting in Google Analytics
Building custom audiences in Facebook, Instagram, Twitter, and Google is one of the best strategies you have as a social media advertiser.
The Audience report helps with this strategy by showing data on where your traffic originates from, what pages people like (or don’t like) most, their demographics, behavior, and more.
It’s incredibly useful for creating more targeted audiences as well as content that appeals to them.
The Overview section of this report shows a lot of high-level insights into the data you can review in the Audience report.
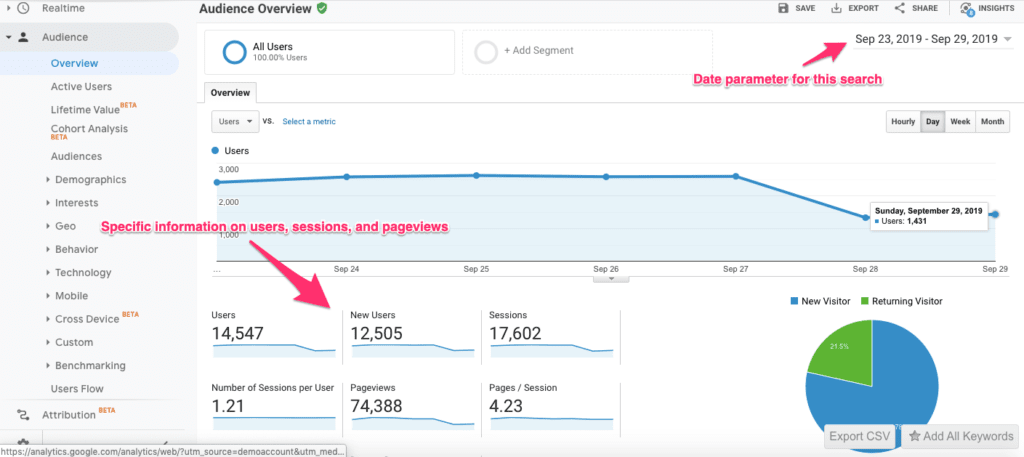
It displays user, session, and pageview information above the fold and demographics like language, location, browser, and device used (as you can see in the image below).
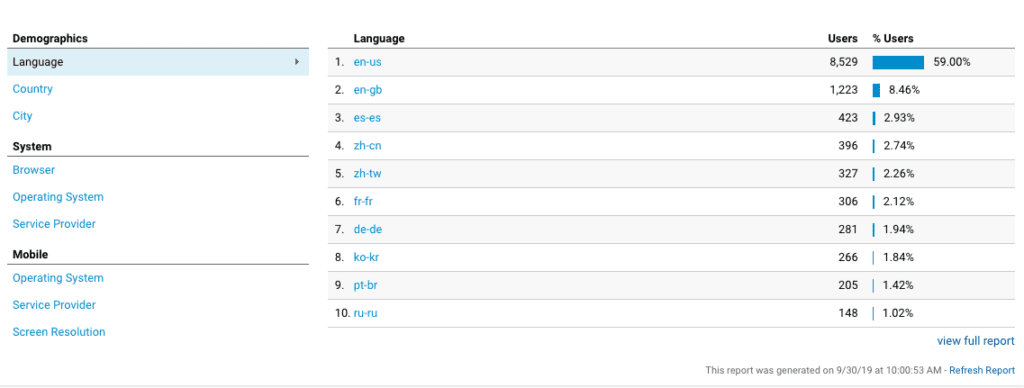

When using this report to refine your custom audiences, the Demographics and Interest reports are going to be most helpful.
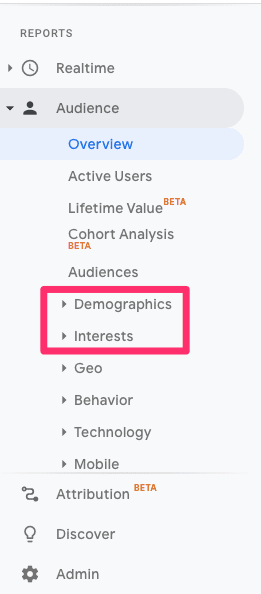

Demographics highlights age and gender information. Interest goes deeper into Affinity and In-Market segments.
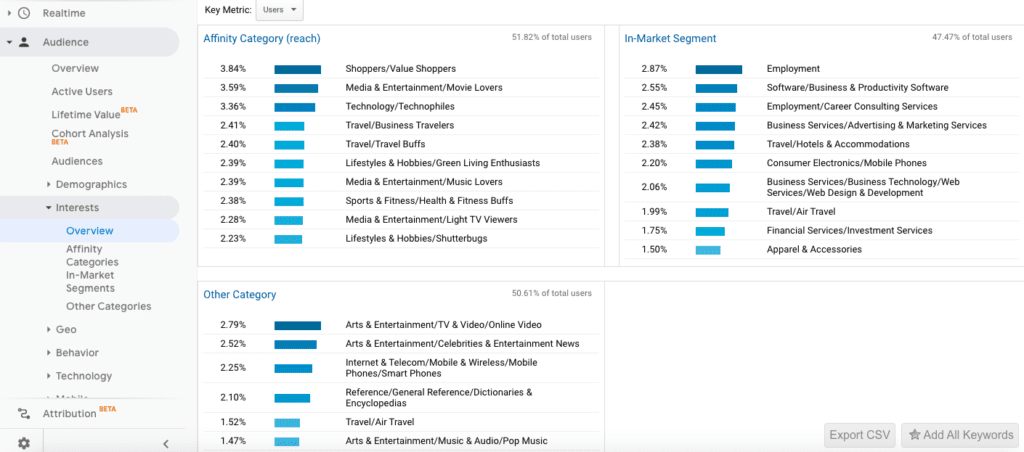

This information will help you create more targeted buyer personas as well as more specific audiences.
For example, if you’re seeing that website users are showing a stronger affinity in the Shoppers/Value Shoppers category, use that information to update your campaigns to focus more on the price and value of your product.
Google also includes their mobile report here, where you can review the different types of devices your website visitors commonly use.
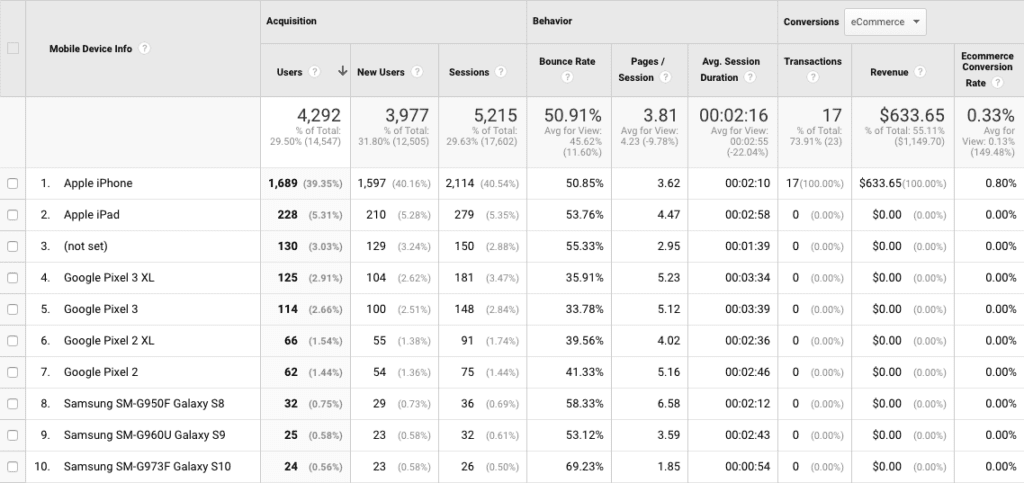
Use that information to see how conversion rates and other metrics differ across desktop and mobile devices.
Whether you’re creating audiences for your campaigns or analyzing how past ads have performed, the Audience report can provide helpful context and insight.
It’s a great place to learn more about the people who actively use your website so you can target them with better ads.
Acquisition Reporting in Google Analytics
The Acquisition report is probably the most important report for social media advertisers and marketers.
This is where you can see how and where you’re attracting new site traffic.
Basically, it’s where you can see which ads and platforms drive the most traffic to your website.
In the Overview section, you’ll see a breakdown of each channel as well as session and conversion growth for the time period you’ve defined in the top right.
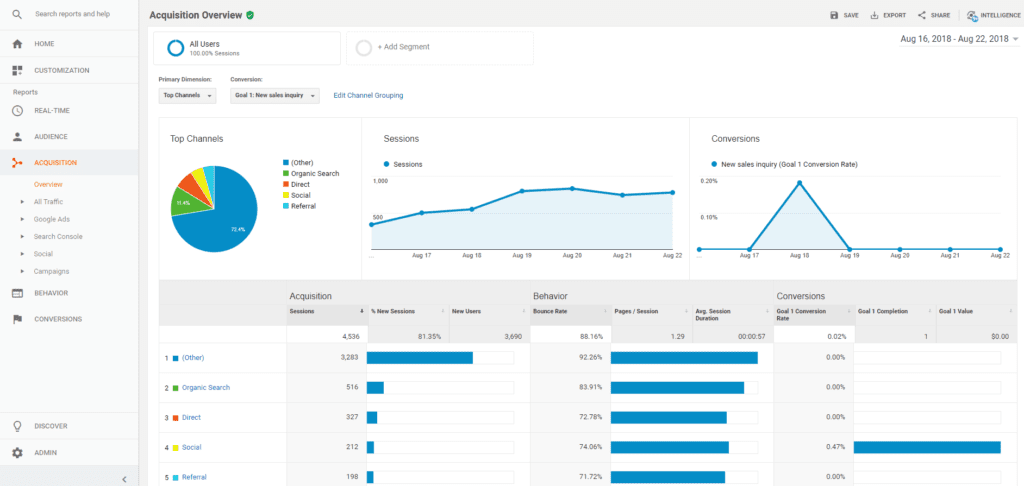

Google breaks down your traffic into 8 categories:
- Organic Search: Traffic that enters your site through a search result on Google.
- Referrals: People who come to your site by clicking a link to your website on another page.
- Social: Anyone who comes to your site through a social media platform.
- Direct: Generally people who go directly to your site by typing in the website URL.
- Affiliates: Traffic from any affiliate marketing efforts.
- Display: All traffic from display advertising campaigns (through Google Ads).
- Paid Search: Anyone who comes in through a PPC campaign.
- (Other): Everyone else (traffic with no defined source).
While it’s important to understand how each of these traffic sources contributes to your overall site traffic, the most important for social media marketers and advertisers is the Social report, which you can find in the left-hand drop-down menu.
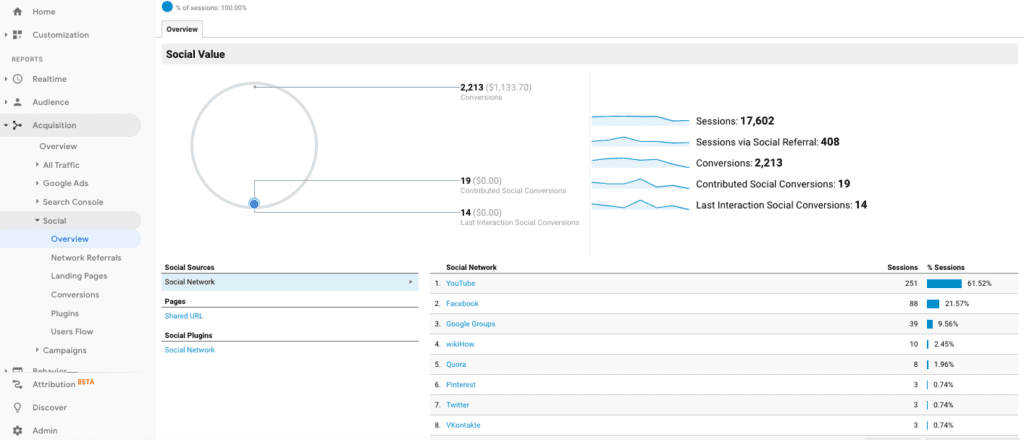

This section of the Acquisition report lets you track which social media platform performs best for your brand.
It shows where traffic comes from, the pages they land on, how long they spent on the page, and more.
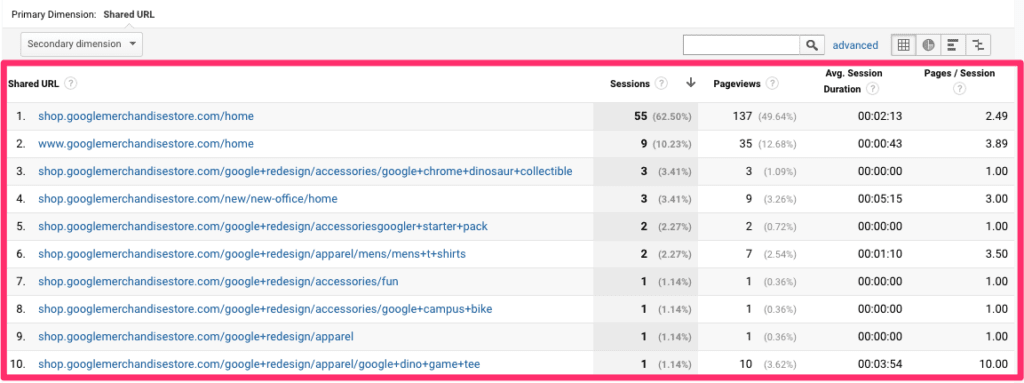
Use the “Network Referrals” section to get a run-down of each different platform.
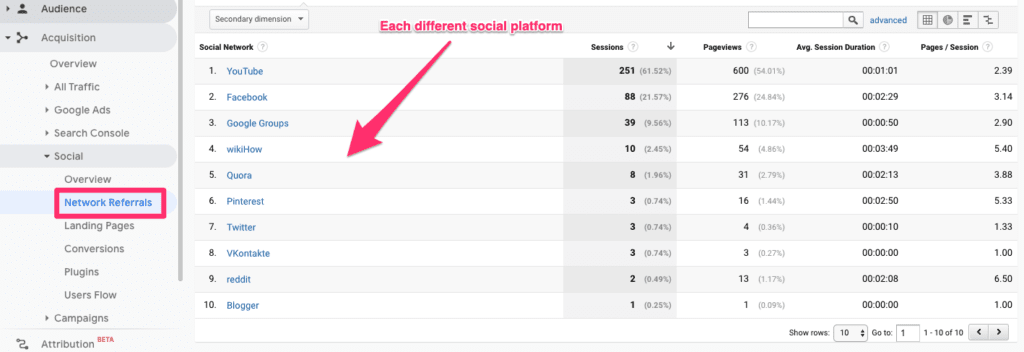

Then, click on the one you want to research to see more data on pageviews, sessions, and URLs.

This information helps you justify investment in certain channels over others and can inform your overall bidding strategy.
Behavior Reporting in Google Analytics
The behavior report provides insight into what visitors do once they land on a page or move within pages on your website.
Think about it as an extension of the Acquisition report.
Use it to track which content performs well on your site and to see which types of content your website visitors like most.
Then use that information to share similar content on social platforms!
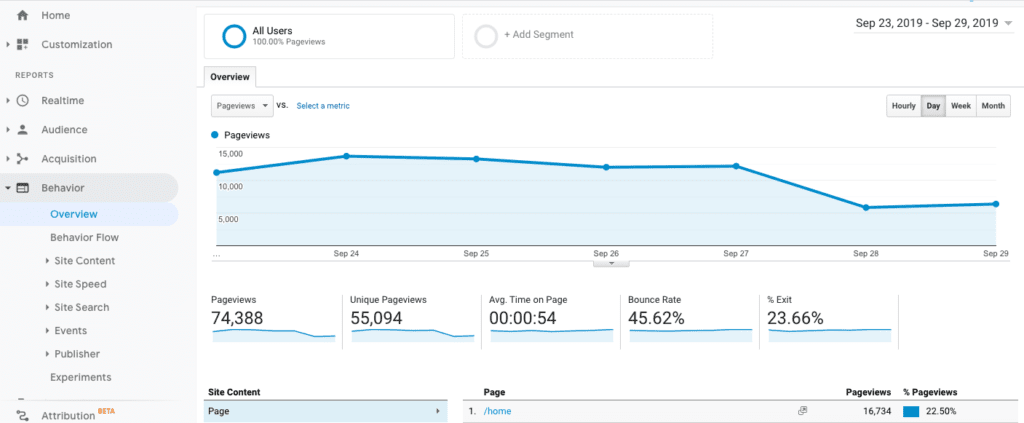

The Overview acts as your entry point to more granular types of information.
From there, one of our access “Site Content” reports, where you can see how any page of your website performs on an individual basis.


With this report, it’s easy to drill down into any page on your site and see how social media factors impact it.
Just add a secondary dimension to the report and look at how people are interacting with your site in relation to how they were acquired.
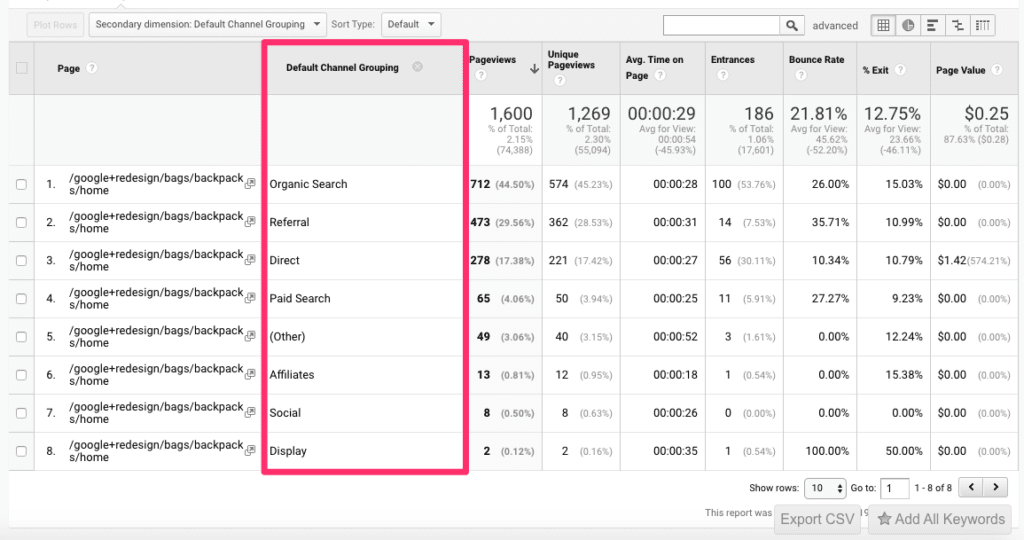

Another good secondary dimension to use is “Social Network,” which breaks down the same data by specific platform.
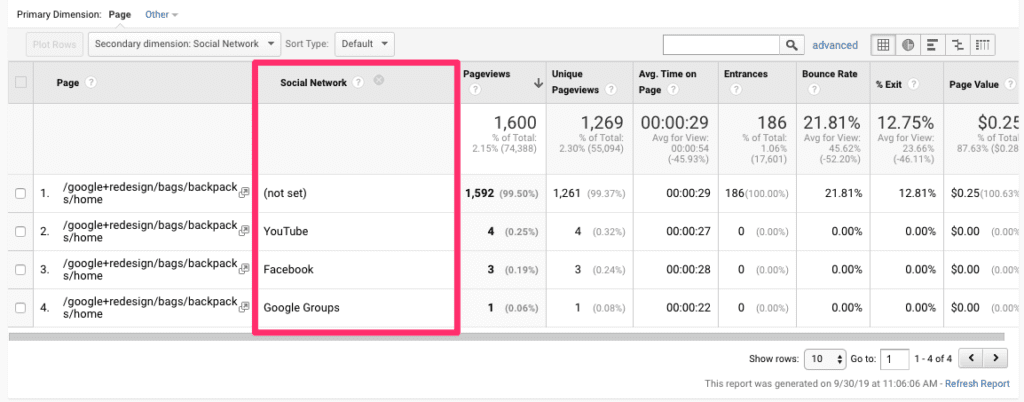

Using the Behavior report, it’s easy to learn more about how visitors interact with your site.
It shows you the content users love, the pages they frequent, and how each social platform interacts with your website.
This just touches the surface of what’s possible, but we hope it gives you enough information to dig in on your own.
Conversions Reporting in Google Analytics
The Conversions report shows how, when, where, and potentially why website visitors convert on your website.
When you set a conversion goal, like making a purchase or signing up through a form, it is tracked here.
Using the Overview report will give you insights into the success of these goals in aggregate.
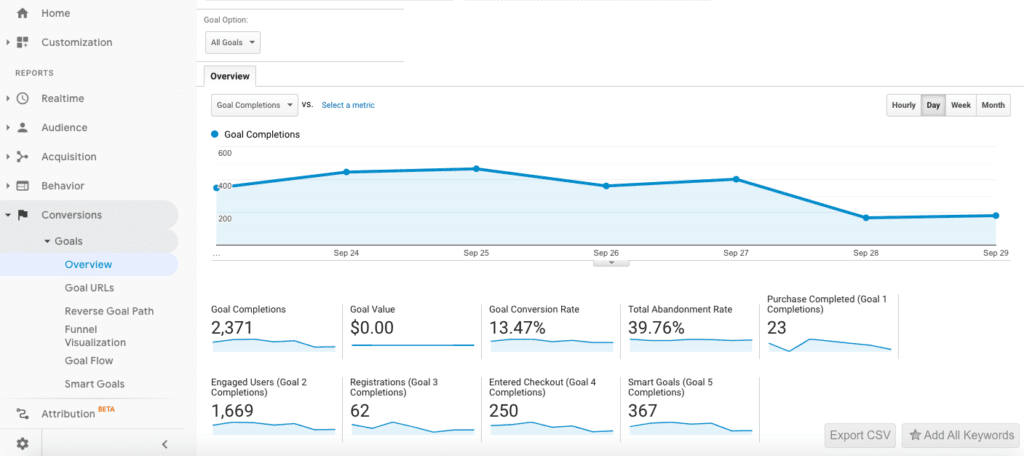

The conversions report will only be helpful once you’ve set up your goals (like we discussed in the previous section) but it’s definitely one of the most valuable sections of Google Analytics for tracking specific KPIs.
You’ll see overall performance across a number of different goals in a quick and easy-to-read view.
This report tracks how many people completed a goal, your overall conversion rate, and any other metrics defined by your individual tracking goals.
And, you can use “Funnel Visualization” to make sure everything is working together.
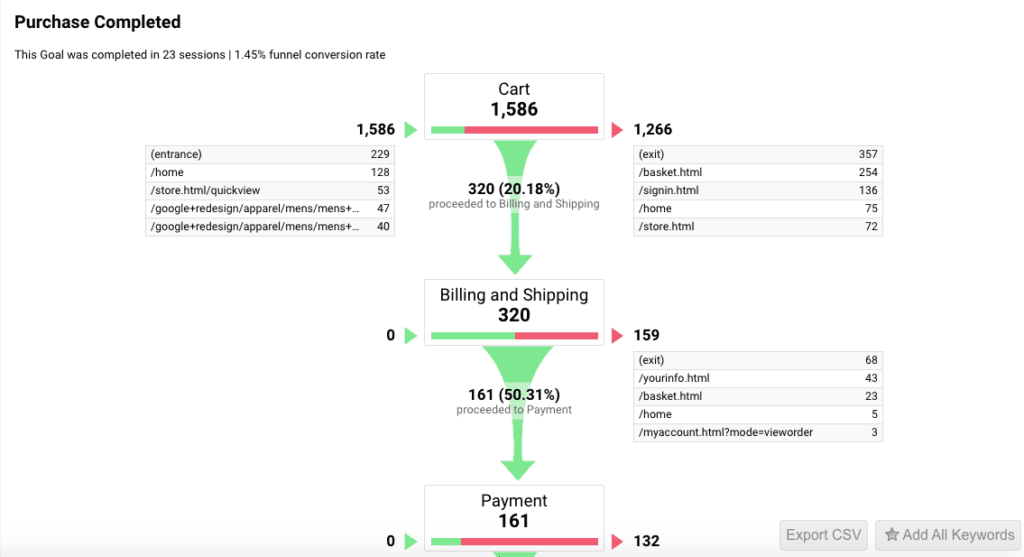

Use the Conversion report to track how well your ads are meeting the goals you’ve set for them.
Whether you’re looking to move customers closer to making a purchase, signing up for a newsletter, or just landing on your site to learn more, the Conversions report will help you see how it all fits together.
Now Go Crunch Some Data and Get to Work
And there we have it—a quick breakdown of the various different reports available in Google Analytics and how to use them. Each of these reports provides a different level of understanding into how your ad campaigns impact user interaction on your site.
But remember, this is just the beginning. There’s so much Google Analytics can do for your social media campaigns—the possibilities are endless!
When you use Google Analytics for social media, it helps you level up your campaigns across the board. We know there’s a lot to learn, but once you read our guide and start using the tool, it just gets easier over time.
In no time, you’ll be building your own reports, creating dashboards, and learning more than you ever thought possible about every campaign.
Let us know in the comments how you like to use Google Analytics for your own social media reporting, we want to learn from you!