
Have you ever looked at an ad campaign and tried to determine whether or not it was worth the money, or worth continuing to run? Understanding how to interpret the metrics available to you through Facebook Ads reporting is just as crucial as knowing how to set up a campaign.
Without a solid understanding of which metrics to track and value and which to ignore, you can end up wasting ad spend on campaigns that aren’t doing what you need them to. Familiarity with metrics and ads reporting tools can make the difference between success and frustration on the platform.


To help you get these results, we’re going to take a look at everything you need to know about Facebook Ads reporting, including the metrics you should track, tools to use, and templates that can help.
Facebook Ads Reporting: 6 Core Metrics to Track & What They Mean
The Facebook Ads reporting dashboard can be a little overwhelming when you see it for the first time. There are a long list of metrics that you can review, and even more that you can add to the dashboard to view that aren’t there by default. It can be difficult to know which metrics matter and which don’t, and what they mean for your campaigns.
As a reminder, when you’re looking at your ads dashboard, there are some metrics that aren’t shown by default but that can be valuable.
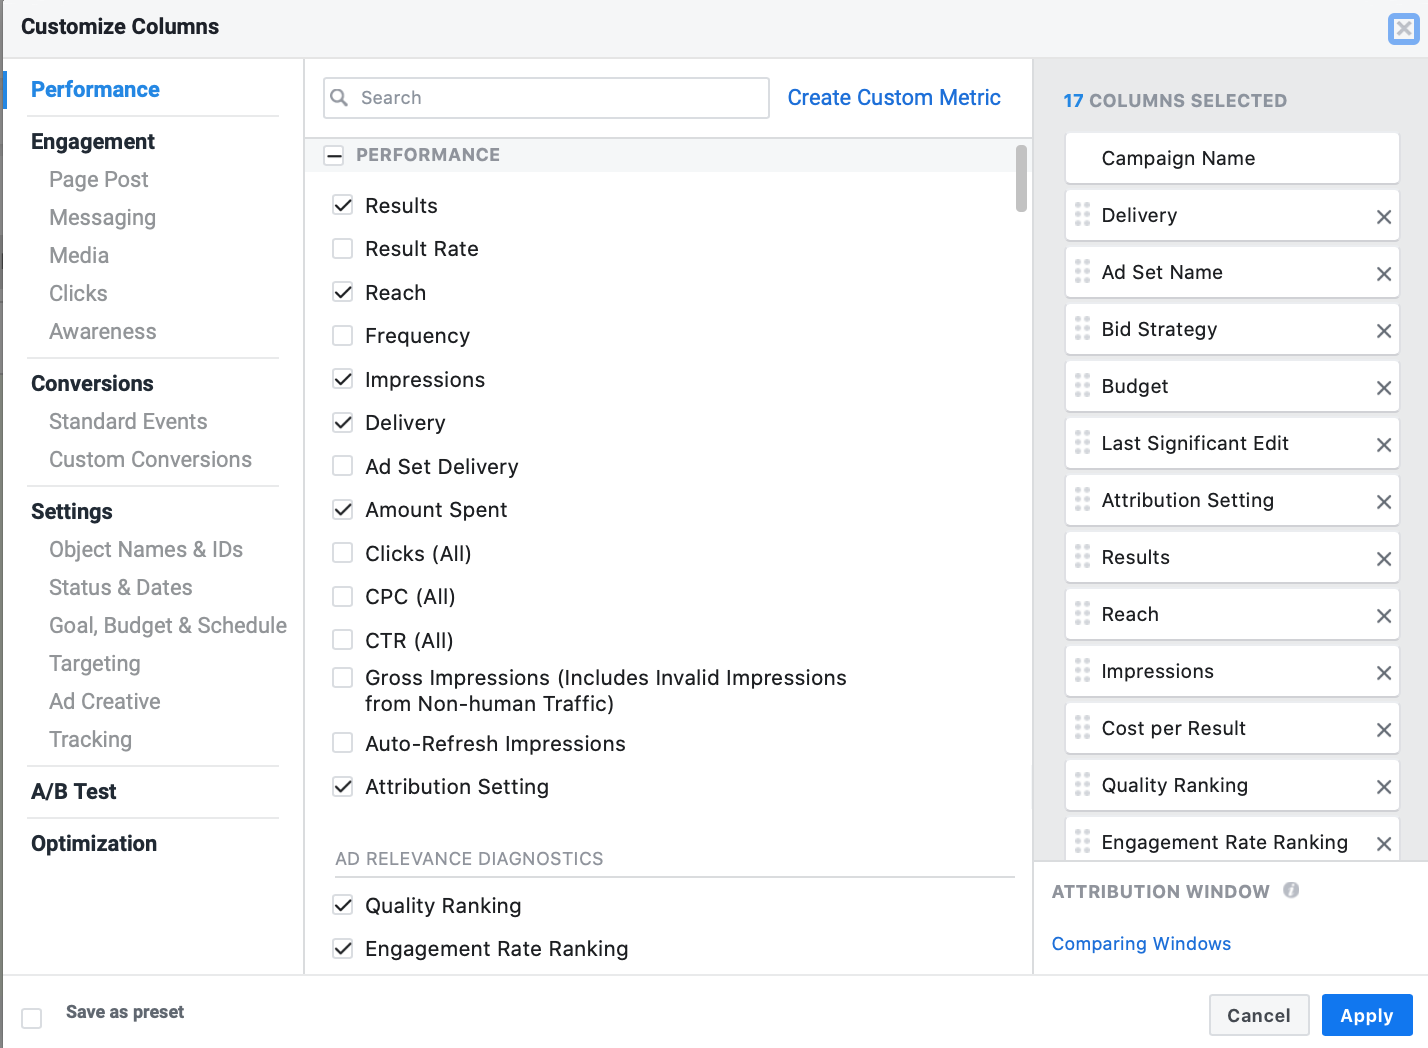
In order to add these to your dashboard so you can view them, click on the blue plus sign in the top right corner of the Facebook Ads manager reporting section.
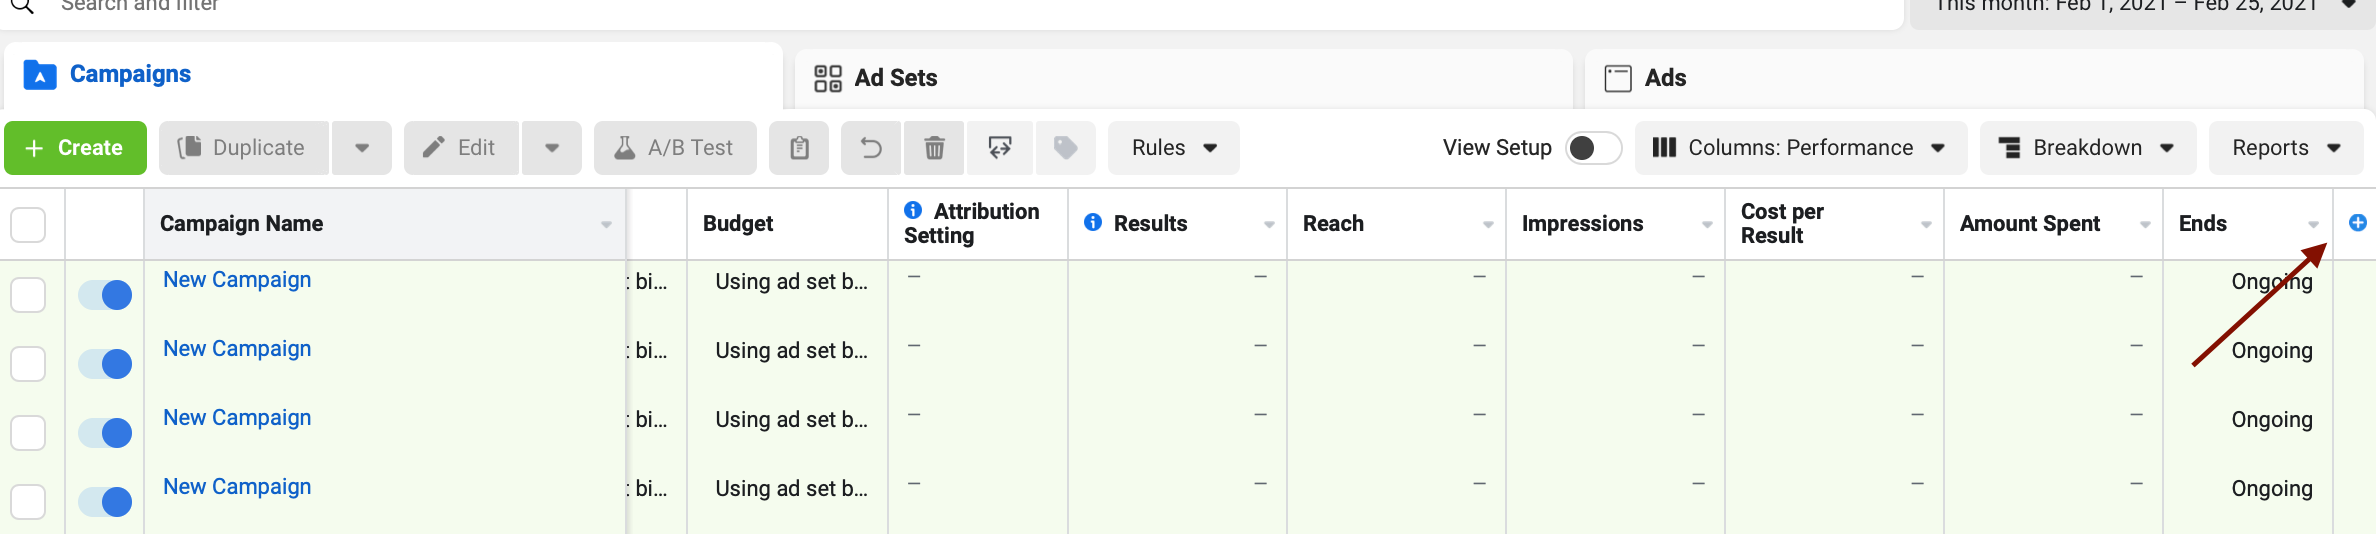

This opens up a drop-down menu where you can add a number of different metrics to that home-page dashboard, including CTR, CPC, and frequency.

Let’s look at which metrics you should prioritize and how they impact your ad performance.
1. Results & Result Rates
Your results tells you how many times users have taken the action that you’ve optimized your campaign for. This can be watching a video, clicking to your site, filling out a lead form, making a purchase, and any other event that you can track on Facebook. Your results rate essentially tells you the conversion rate, or how often people who see your ad will take that specific action.

These are some of the most important metrics you can look at. They’ll show you which campaigns are most effective at driving the results that you want. You can even measure which campaigns were most effective at driving different types of actions, like if one campaign drives plenty of “adds to cart” but only a small number of conversions.
2. Cost Per Action (CPA)
You should also pay attention to your cost per action when assessing your campaigns. This may sometimes show up as cost per click (CPC), or something like cost per download. The CPA metric tells you how much you’re spending for each action that you’re bidding on.
It’s important to keep an eye on your CPA so you can ensure that your campaigns are profitable. If you’re spending $5 per lead and can only afford $4, you’ll run out of ad spend and can hurt your overall business quickly. You can set caps on bids to prevent this.
One important note: Don’t automatically pause higher-cost campaigns. Sometimes a campaign that has a $5 click is sending higher-quality audience members your way than a $3 click. This means that users are more likely to convert or convert at a higher value. Watch the numbers closely before reacting.
3. Reach
Your reach tells you how many unique individuals you’ve reached with a single ad in a set time frame. This is more valuable than impressions alone, because you can see how many people are seeing your ad in total. If you have a reach of 10,000, it means that 10,000 people saw the ad; if you have 10,000 impressions, it just means the ad was seen 10,000 times from any number of users.
You want to make sure that your reach is wide enough that you can get results, and that your ad is actually being delivered. If not, you can run into frequency issues (which we’ll discuss in just a minute) or your audiences may be too small.
4. CTR
CTR is your click-through rate, which tells you how many people clicked on the ad.
CTR isn’t the be-all-end-all, but it’s useful for a few reasons.
The first is that it shows clear interest by the user. They at least wanted to see what came after the ad, which is some level of intent.
The second is that it’s a great trouble-shooting metric. If plenty of people click on your ad but then don’t convert, it may mean any of the following:
- Your Facebook landing page isn’t strong enough
- You’re not quite targeting the right audience; maybe the offer is still too expensive or doesn’t align with their budgets or needs
- The ad isn’t successfully explaining the offer enough that they’re motivated to act
CTR should not be used in place of conversion-oriented metrics, but it’s useful to assess the health of your campaigns overall.
5. Frequency
Frequency isn’t going to be a shining beacon of knowledge when it comes to your overall campaign performance, but it’s a metric that you still want to keep your eye on with Facebook Ads reporting.
Frequency tells you how often a single user sees the same exact ad within a set period of time. This is so essential, because if users see the same ad ten times, it’s not nearly as effective as ten different users seeing your campaign. They reach a certain point where the likelihood of converting on that single ad decreases significantly, and you’re wasting potential ad placements.
It’s best to keep your frequency at a three or under. Some repetition is okay, but if it’s higher, it’s worth revamping your campaigns or checking your audience. Ad fatigue is a real problem that could derail your campaigns.
6. Quality Ranking
Your quality ranking (which used to be called your “relevance score”) is a semi-black-box metric on Facebook that tells you how relevant your ad is to your audience according to their algorithmic calculations. Ads with higher engagement, CTR, and conversion rates see higher quality ranking; ads with negative reactions, low engagement rates, and “this isn’t relevant to me” markers go down.
Your quality ranking can actually impact your ad costs, with more higher-ranking ads being given lower CPCs by Facebook. For this reason, it’s worth keeping an eye on, but if you’ve got campaigns with only decent scores that are getting you the results you want, there’s no reason to pause them.
Which Metrics Aren’t As Important?
All metrics can tell you something about your campaign, but some just aren’t as crucial as others.
There are several “vanity” metrics that new marketers might be impressed by, but that ultimately don’t carry much weight in performance overall. These shouldn’t be the focus of your attention, as honing in on them can keep you from prioritizing more important metrics, though they can be useful if you’re ever looking to troubleshoot ads.
Not-as-important metrics may include the following depending on your campaign:
- Impressions. While it’s helpful to making sure that people are seeing your ad campaign, reach can tell you how many unique users are seeing your ads. Other metrics are more important when gauging the overall success of your campaign, because they only tell you how many people saw your ad and not the quality of those audiences.
- Engagement such as likes or comments. It can be exciting to have people liking or commenting on your ad, but if that’s all they’re doing and the point is to drive off-platform action, it isn’t enough. Focusing too much on likes (which are vanity metrics even for organic marketing) won’t deliver any meaningful results.
- Amount spent. Because there’s so much to look at, some new advertisers look at the “amount spent” tab and immediately want to pause high-cost campaigns. This can be misleading though when looked at on its own. If you have two similar campaigns and one costs more, it may also result in more actions or higher-quality leads. This should not be a metric you look at in a vacuum, so to speak, without considering what else is happening around it.
2 Facebook Ads Reporting Tools to Consider
Want to dive deeper into Facebook Ads analytics reporting? There are some tools that can offer advanced analytics features.
Let’s take a look at the two best Facebook Ads reporting tools for businesses.
1. Facebook’s Ads Manager Reporting Tool
The native Facebook Ad reporting tool is one of the best. It’s free, it’s accessible, and it’s easy to both use and find. It gives you all the basic information you need (including a good look at the core metrics we discussed above), but you can also download Facebook ad spend reports and other files through excel documents.
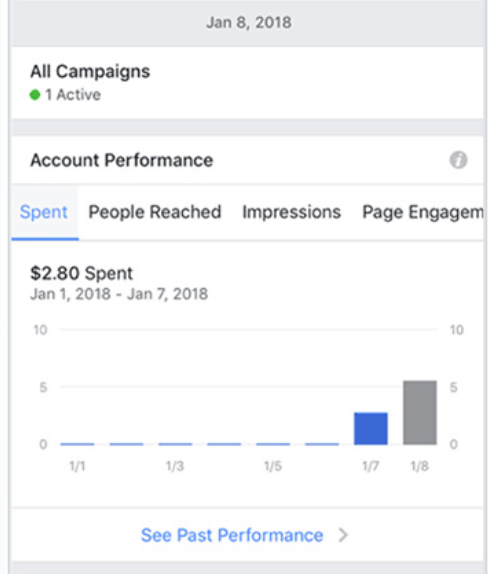

They even have an Ads Manager mobile app for iOS and Android devices to keep an eye on your ads on-the-go, though it’s decidedly easier and more effective to use desktop.
2. AdEspresso
AdEspresso is all about Facebook Ads automation and optimization to give you higher quality results. We use massive amounts of data and our own algorithms to do this, and we’re happy to pass along detailed Facebook ad reporting analytics to you, too.
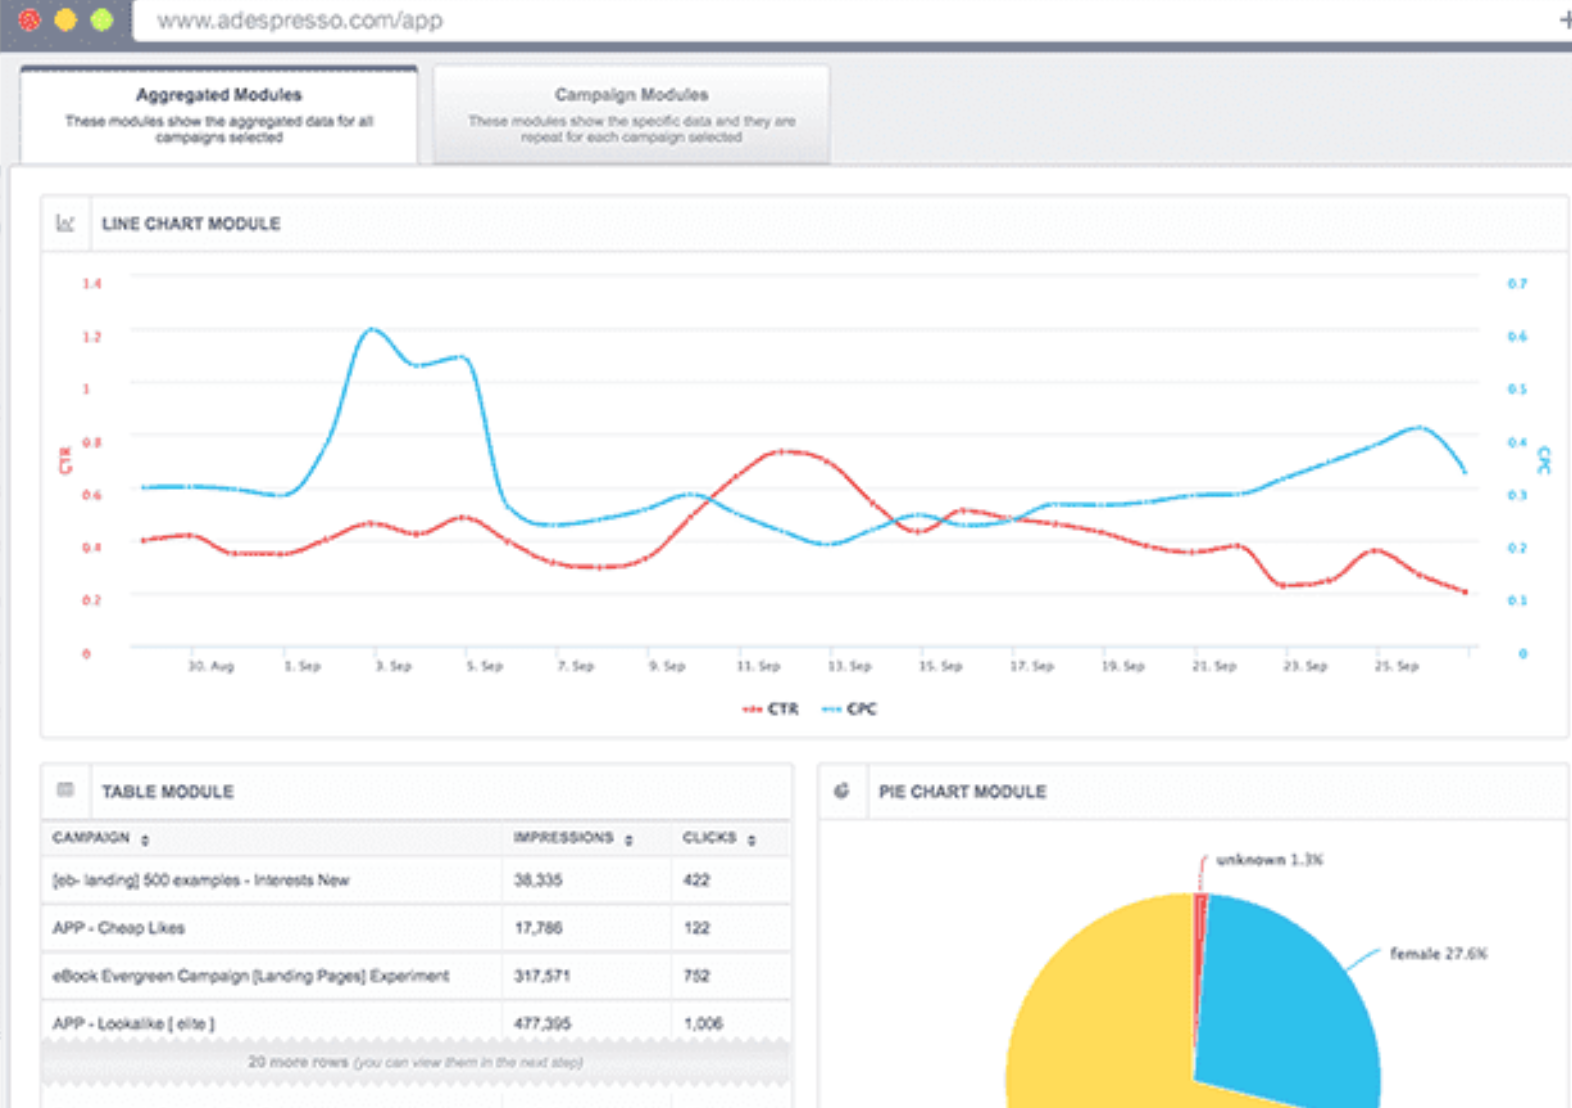

Our analytics can show you all the important metrics you need to know, allowing you to customize your dashboard to see all the data you want and nothing you don’t so you can act quickly. We also offer reporting downloads, so you can share the data with your boss, with clients, or even just your filing cabinet if you choose.
Facebook Ads Report Templates
Speaking of downloading reports, this is a common issue with Facebook Ads. It’s important to collect the right data to show to your boss, teammates, and clients when you’re downloading reports, so having a strong ads template is key.
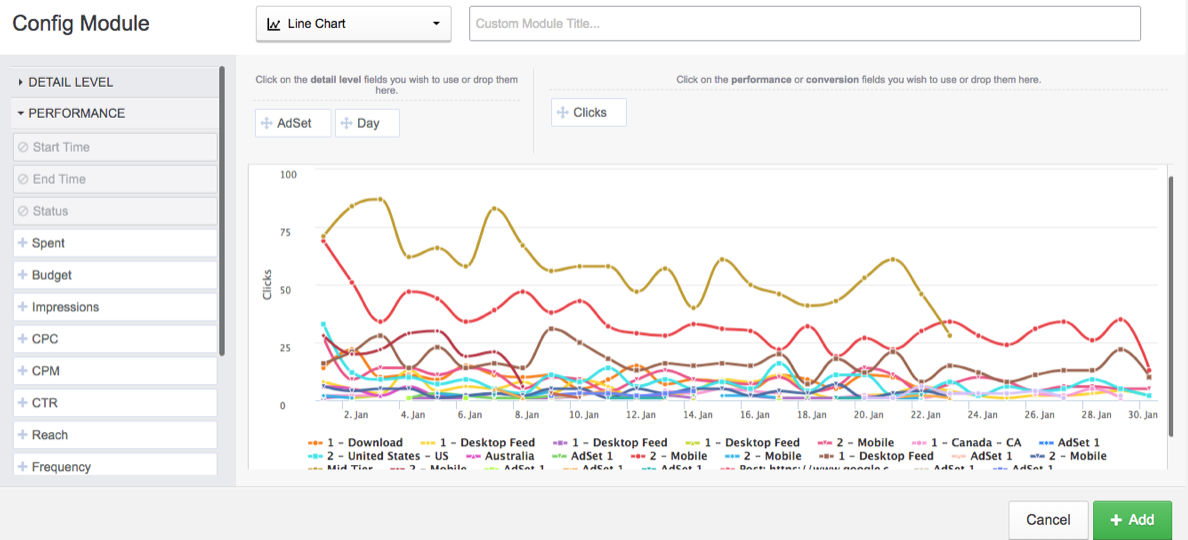
AdEspresso and Facebook Ads both offer the option to create and export PDF reports. AdEspresso’s option allows you to fully customize the information that you’ll be compiling in the report, adding and configuring different models to showcase multiple campaigns and all their key metrics in a single PDF or excel document.

While the information you present will depend on factors like who you’re presenting it to and why, these are the metrics you should typically include in a Facebook Ads reporting template for each campaign:
- Amount spent
- Cost per action / CPC
- Reach and impressions
- Amount spent out of budget
- Results gained
If you’re sharing information about audiences, you can add sections on who different audiences (like those from different locations, custom audiences, or devices) reacted to different campaigns. You can also add sections for metrics like reach or frequency if you’re tracking trends for internal use.
Final Thoughts
Using Facebook Ads reporting to keep an eye on key performance metrics is an essential part of ads management, optimization, and overall success. The right tools can help, and knowing what metrics to focus on is key. Remember to customize the dashboard of your tool of choice to ensure that it’s got all the data you want available at a first glance for easier management moving forward.
Interested in getting started with AdEspresso’s Facebook Ads reporting tool? Start your free trial here.